ASR Service
Use ASR Service to manage the speech recognition scenario data of your project.
Dashboard
Use the Dashboard to view key metrics for the Speech-to-Text service, including request count, audio recognition duration, response times, and critical statistics, as well as service usage trends and response time visualizations.
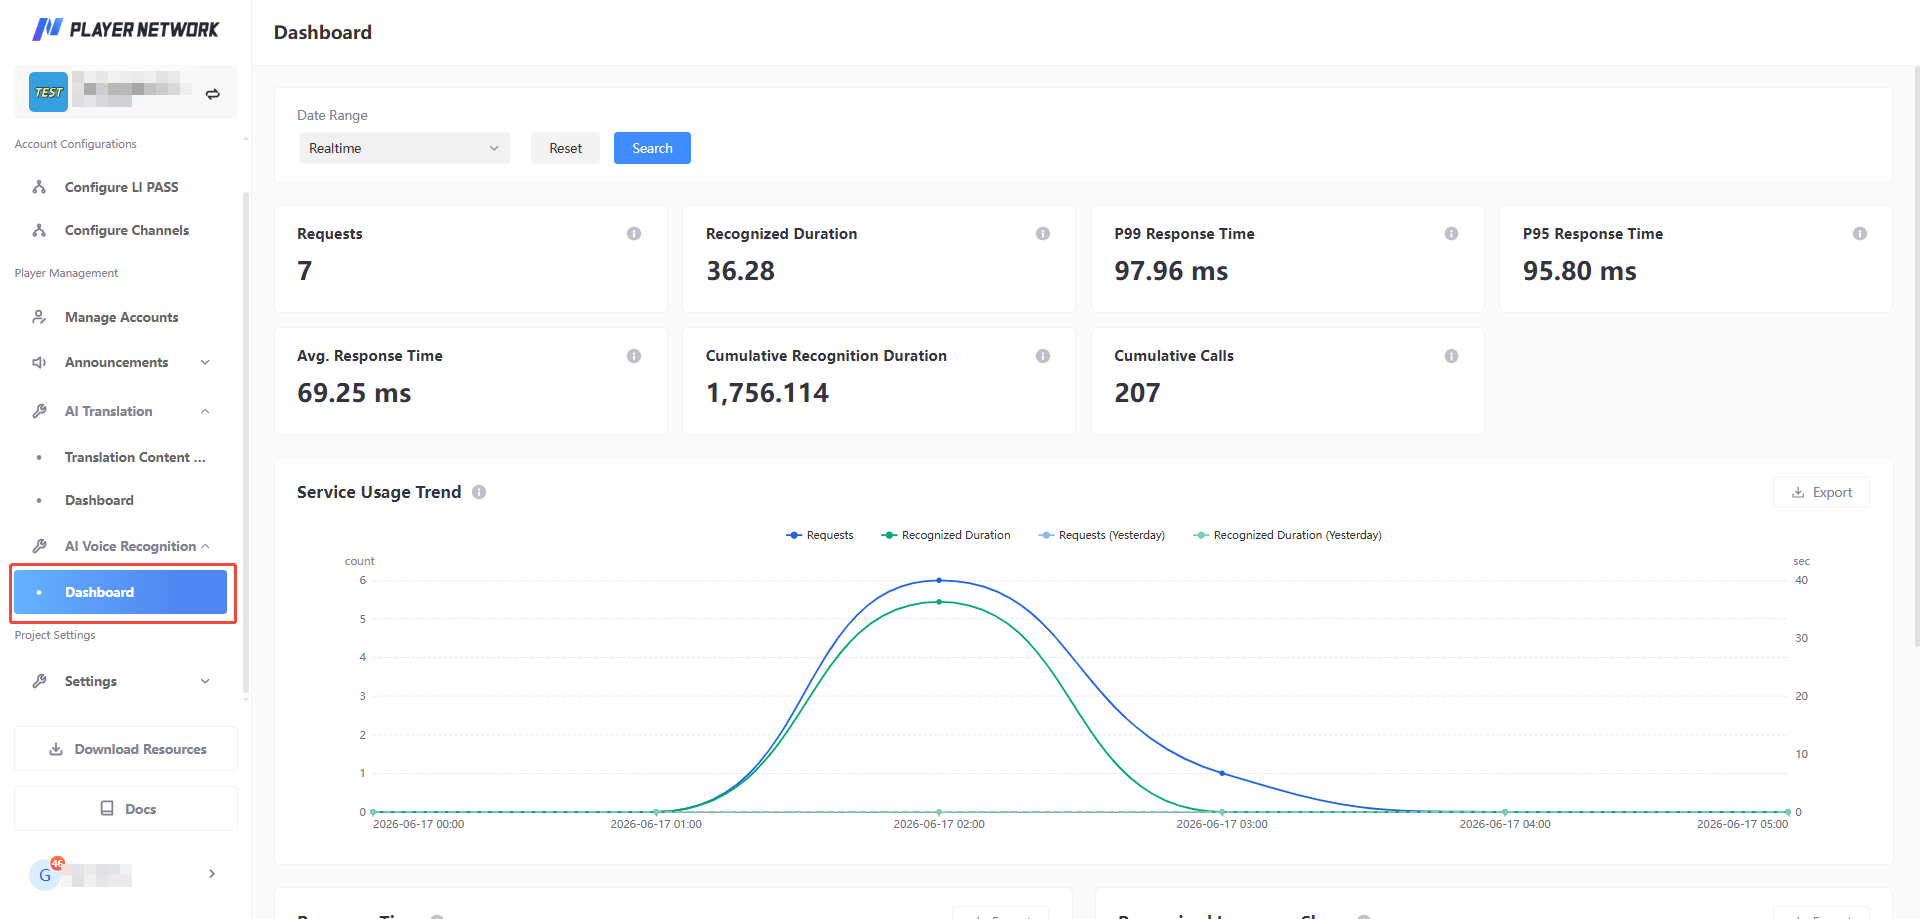
- Log in to the Player Network Console, and in the left sidebar, click Dashboard under ASR Service.
Filter Criteria
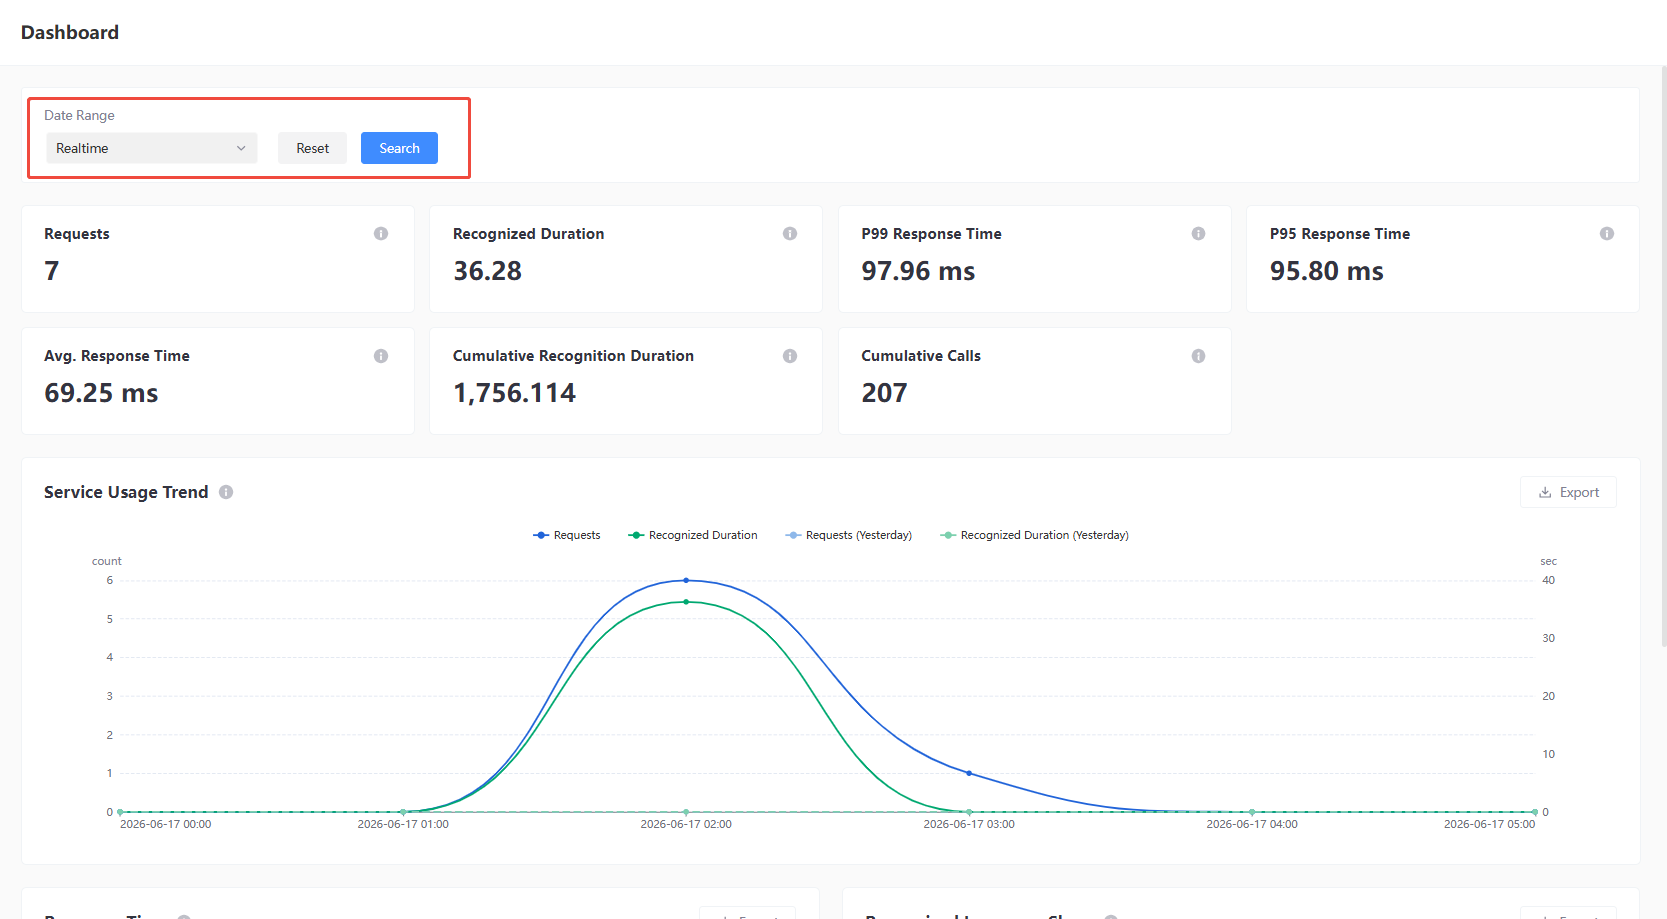
At the top of the dashboard, you can use the following filter criteria to view data for a specified range:
- Data Period: Choose the granularity for statistical data, with options for Real-time Data, This Week, This Month, Recent Ten Days, and more.
After configuring filter criteria, click the Query button to refresh data; click Reset to restore default filters.
Metrics
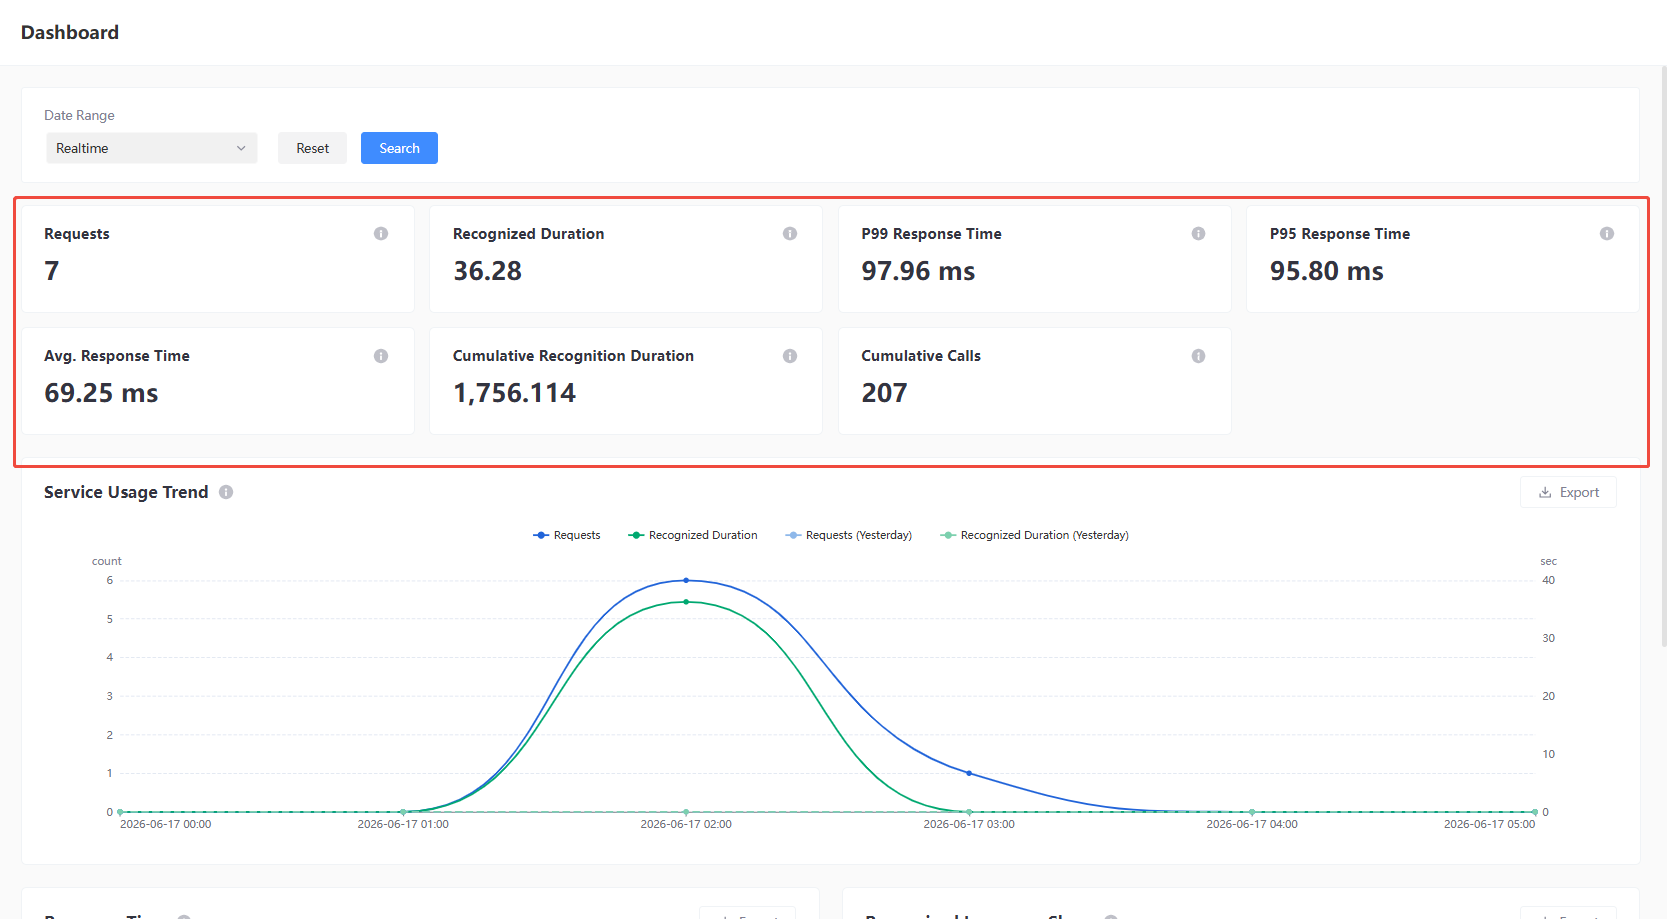
The dashboard displays the following core metric cards:
| Metric Name | Description |
|---|---|
| Request Count | Total number of Speech-to-Text API requests during the current period. |
| Recognized Audio Duration | Total duration of audio processed by the Speech-to-Text API during the current period. |
| 99% Response Time | 99% of requests have a response time less than this value. |
| 95% Response Time | 95% of requests have a response time less than this value. |
| Average Response Duration | Average response duration for all requests during the current period. |
| Cumulative Usage | Total recognized audio duration since business integration began. |
| Cumulative Request Count | Total Speech-to-Text API requests since business integration began. |
Service Usage Trend
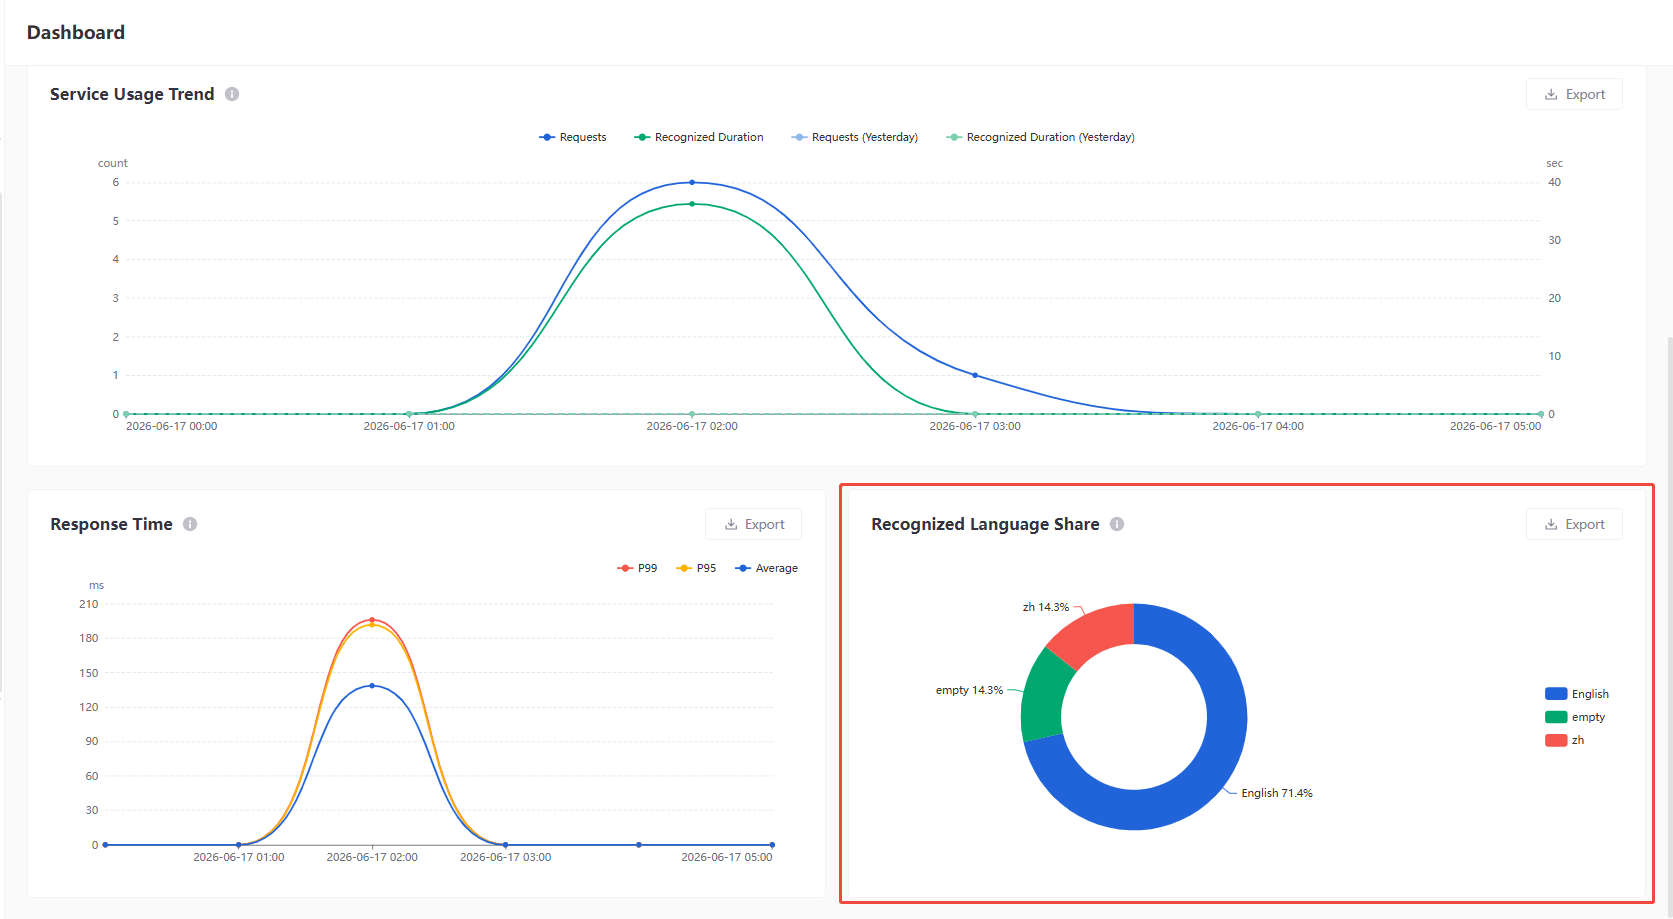
Displays the trend for request count and recognized audio duration during the selected period; real-time data uses dashed lines to compare with the same period yesterday.
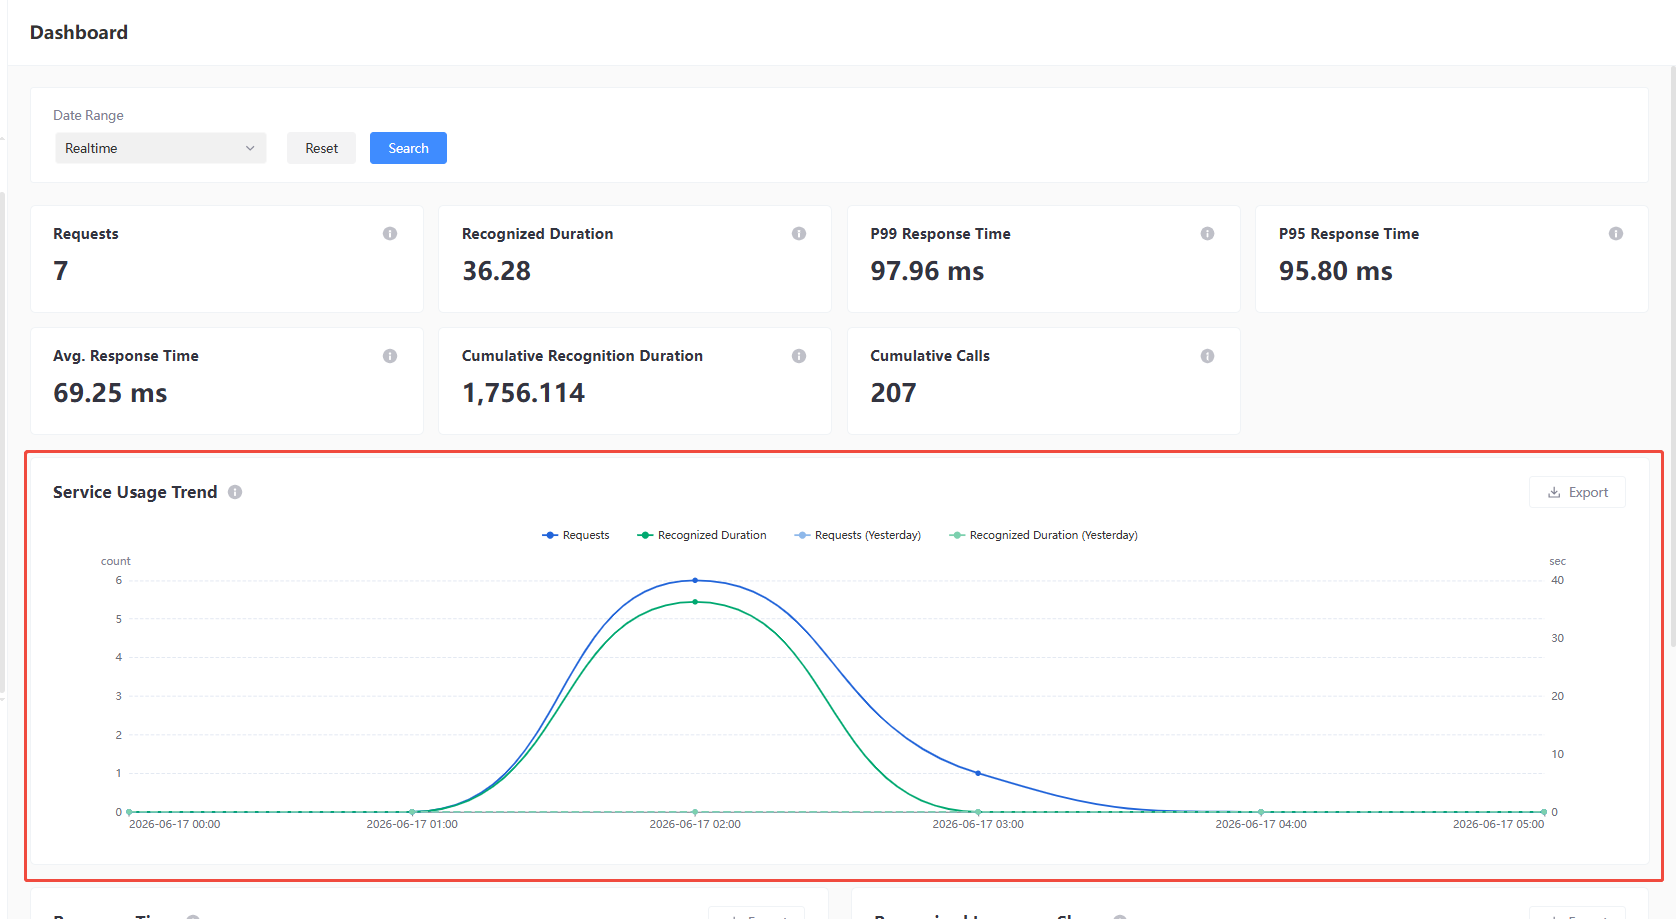
The Service Usage Trend chart visualizes the usage trend of the Speech-to-Text service over time, supporting the following data dimensions:
- Request Count: Displays the request count at each time point.
- Recognized Audio Duration: Displays the recognized audio duration at each time point.
- Request Count (Yesterday): Shows request count comparison for the same time period yesterday.
- Recognized Audio Duration (Yesterday): Shows recognized audio duration comparison for the same time period yesterday.
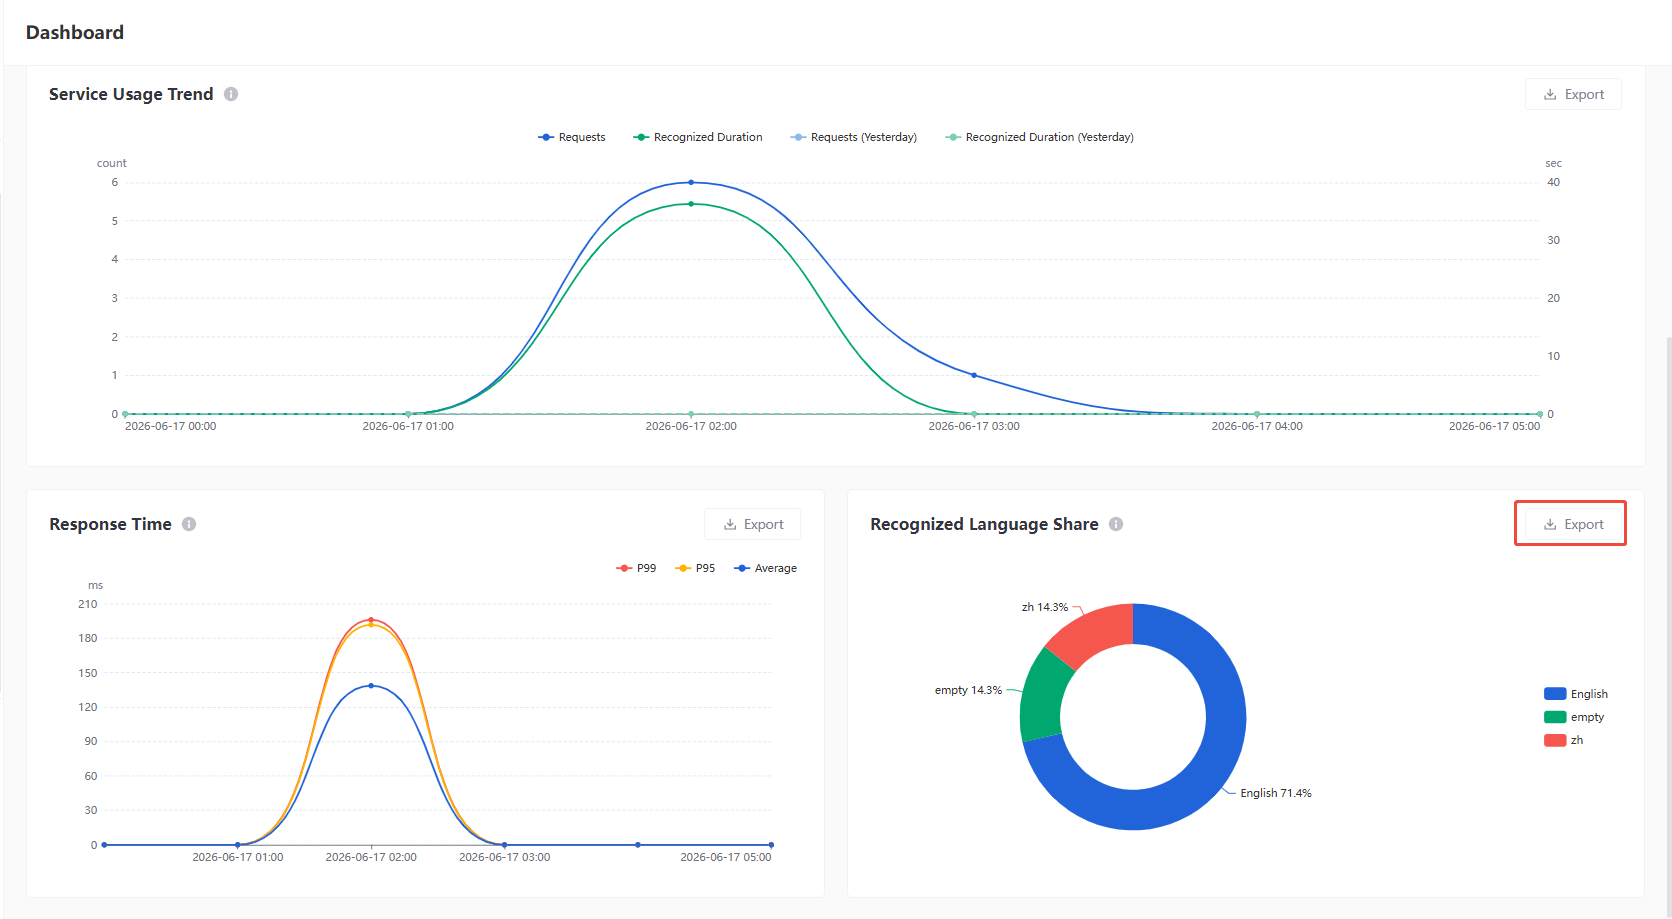
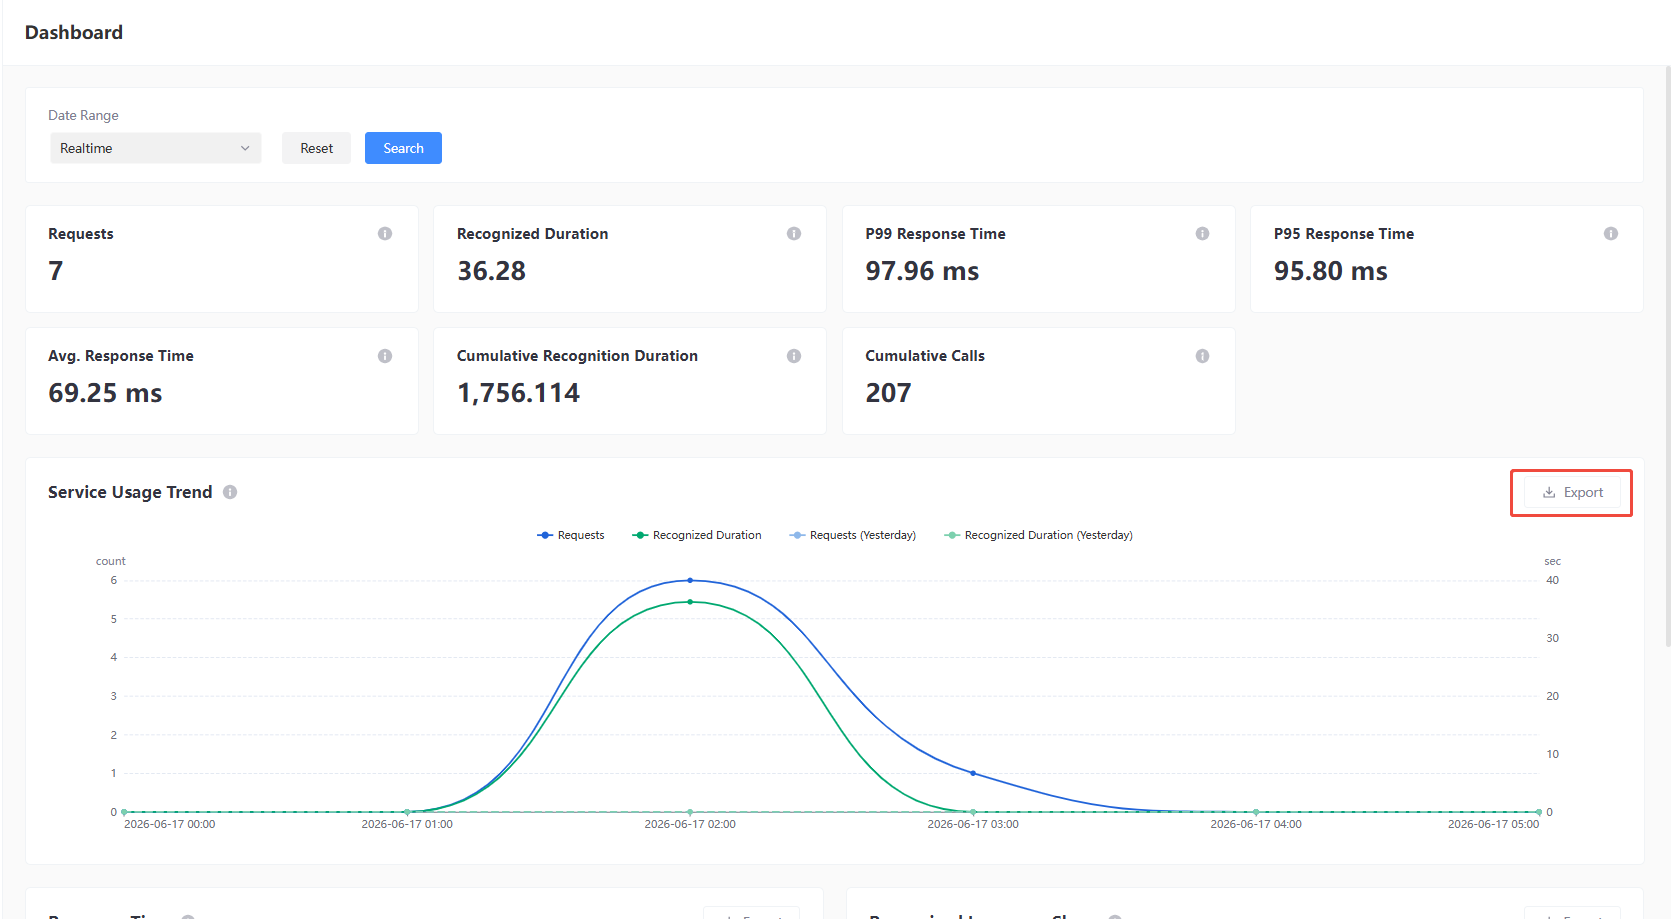
The top right of the chart supports the Export feature, allowing chart data to be exported as a file.
Service Response Time
Displays the trend of 99%, 95% and average response times during the selected period.
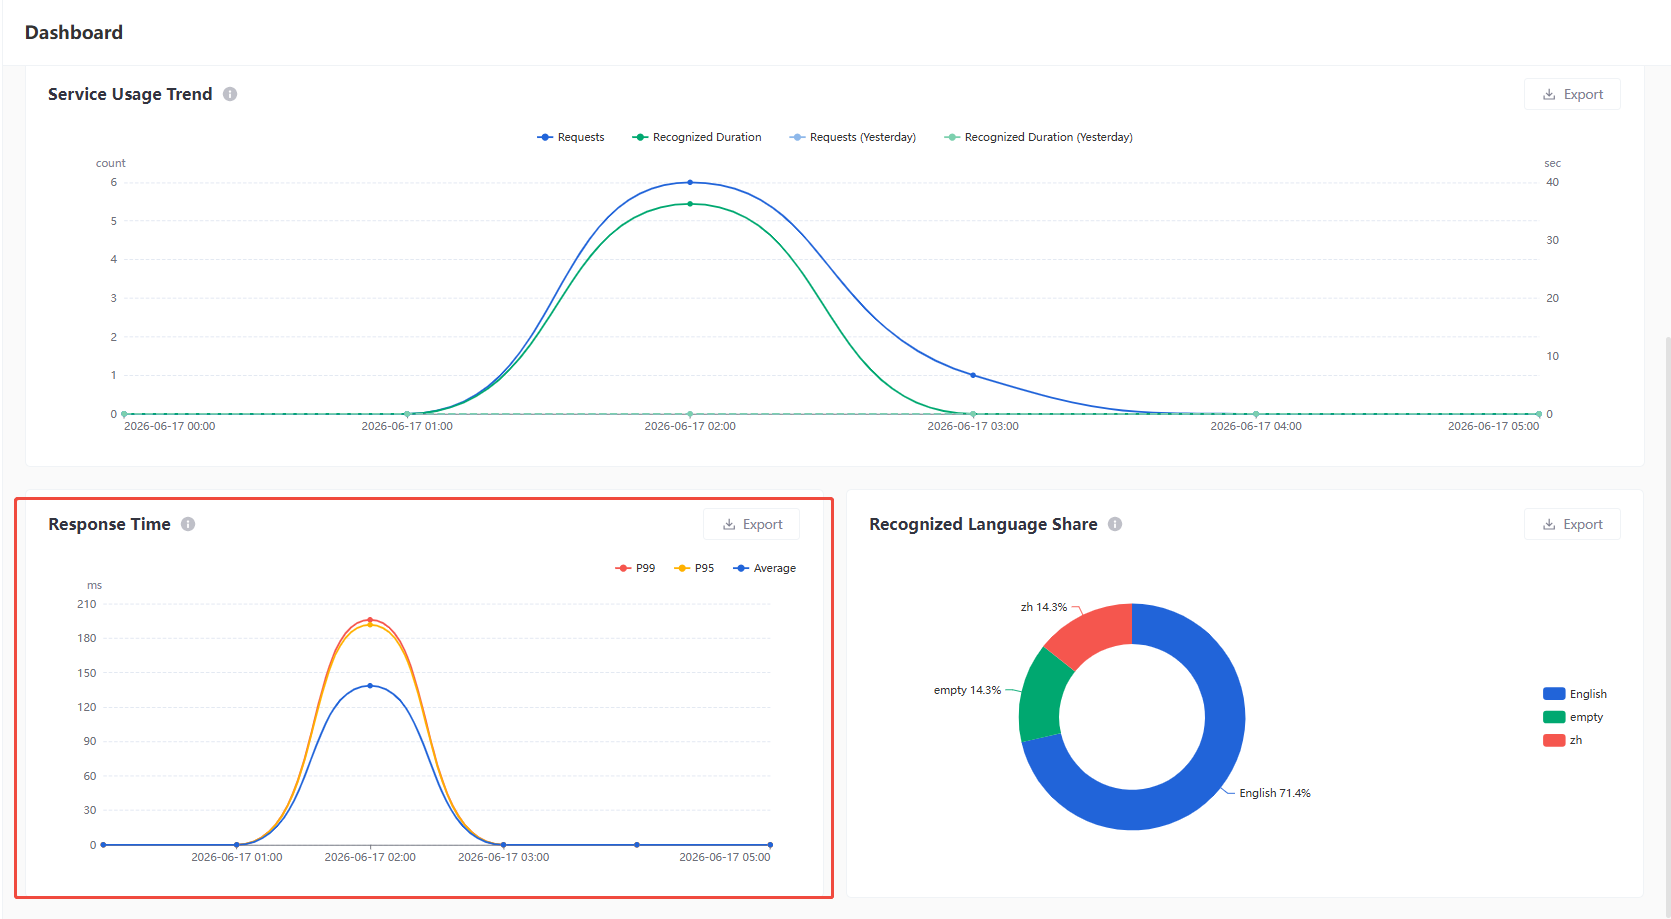
The Service Response Time chart visualizes the trend of response times for the Speech-to-Text service over time, and supports the following data dimensions:
- 99% Response Time: Displays the 99% response time at each time point.
- 95% Response Time: Displays the 95% response time at each time point.
- Average Response Time: Displays the average response time at each time point.
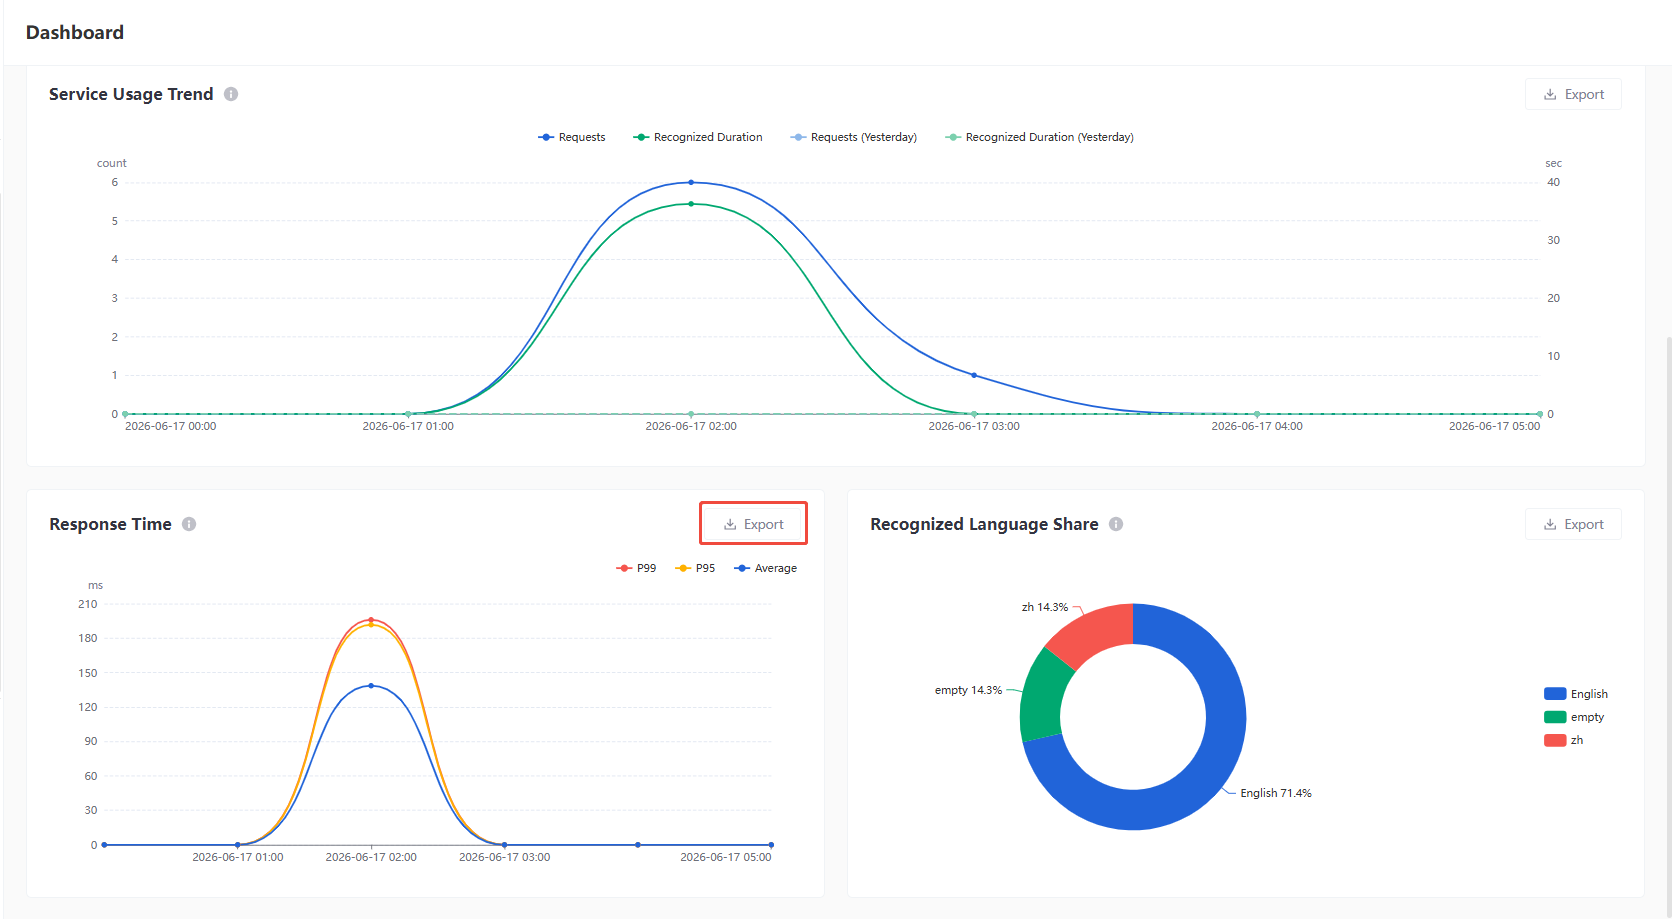
The top right of the chart supports the Export feature, allowing chart data to be exported as a file.
Distribution of Recognized Languages
The proportion of requests by recognition language or output language during the selected period, can be toggled between views.
The Distribution of Recognized Languages chart shows the language usage proportion in the speech-to-text service, supporting switching to view distribution data for either recognition or output languages.
Click the Recognition Language or Output Language label to switch and view the corresponding language distribution.
-
Recognition Language: Shows the distribution percentages of each recognition language in Speech-to-Text requests.
-
Output Language: Shows the distribution percentages of each output language in Speech-to-Text requests.
The top right of the chart supports the Export feature, allowing chart data to be exported as a file.